Table of Contents
Overview
When writing tests, you naturally start wondering: “How much of our code do our tests actually cover?” If you’re using Vitest, test coverage can give you the answer.
This post shares the experience of setting up a test coverage measurement environment in a Vitest-based React project.
If you’re curious about why we adopted Vitest, I recommend reading Introducing Vitest to a Jest Project - View Test Separation Strategy first.
What is Test Coverage
Test Coverage is a metric that quantifies how much of the source code is executed by tests. The key metrics are:
| Metric | Description |
|---|---|
| Statements | Percentage of statements that have been executed |
| Branches | Percentage of branches (if/else, switch, etc.) that have been taken |
| Functions | Percentage of defined functions that have been called |
| Lines | Percentage of code lines that have been executed |
While high coverage numbers don’t necessarily mean good tests, it’s a useful metric for identifying areas where tests are lacking.
Setup
The following configuration is needed to measure test coverage with Vitest.
Package Installation
For coverage measurement in Vitest, we use the @vitest/coverage-v8 package. It leverages V8 engine’s built-in coverage capabilities, so accurate coverage can be measured without separate code instrumentation.
Install the package in your React project directory.
yarn add -D @vitest/coverage-v8Adding Scripts
Add a coverage execution script to your React project’s package.json.
{
  "scripts": {
    "test:view": "TZ=Asia/Tokyo vitest",
    "test:view:ci": "TZ=Asia/Tokyo vitest run",
    "test:view:coverage": "TZ=Asia/Tokyo vitest run --coverage"
  }
}
The vitest run --coverage command runs Vitest once without watch mode while collecting coverage data.
.gitignore Configuration
Since coverage reports only need to be checked locally, add the generated coverage/ directory to .gitignore.
coverage/Running and Viewing Coverage
Once the setup is complete, you can generate coverage with the following command.
yarn test:view:coverageWhen execution completes, a ./coverage/index.html file is generated. Open this file in a browser (or VSCode’s Live Server) to view a visual coverage report.
How to Read a Coverage Report
Below is an example of an actual coverage report.
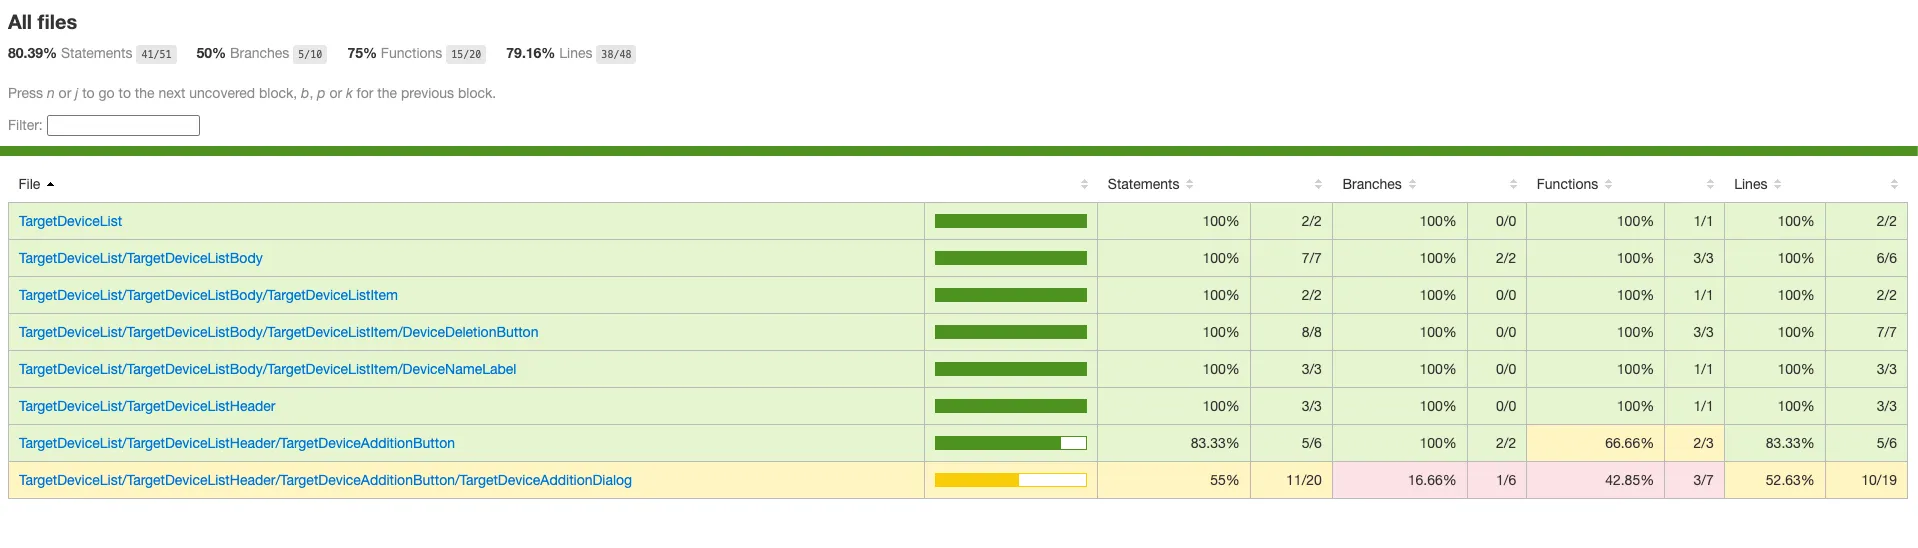
The key information you can identify from this report includes:
- Overall Coverage: Statements 80.39%, Branches 50%, Functions 75%, Lines 79.16%
- Per-component Coverage: View coverage for each component file individually
- Color-coded Overview: Green indicates high coverage areas, yellow/red indicates areas that need improvement
For example, in the report above, TargetDeviceAdditionDialog has Statements at 55% and Functions at 42.85%, which is lower compared to other components. This way, test coverage makes it easy to identify components that need additional tests.
On the other hand, DeviceDeletionButton, DeviceNameLabel, and others have achieved 100% coverage, indicating that sufficient tests have been written.
Summary
In this blog post, we introduced how to set up a test coverage measurement environment in a Vitest-based React project.
By leveraging Vitest’s coverage features, you can clearly understand which parts of the code your tests execute in a React project. This helps you prioritize test writing and continuously improve test quality.
Try using coverage reports to identify components with insufficient tests and determine your test writing priorities.
Related Posts
- Testing Strategy for Common Components in a Monorepo
- Introducing Vitest to a Jest Project - View Test Separation Strategy
- Building Component VRT + Accessibility Testing with Vitest
Was my blog helpful? Please leave a comment at the bottom. it will be a great help to me!
App promotion
Deku.Deku created the applications with Flutter.If you have interested, please try to download them for free.