outline
we’ve submitted an app for review but rejected by App crash reason. Apple sent kindly rejected reason and crash log files. so in here we will see how to analyze crash log files and find where problem is.
App review rejection
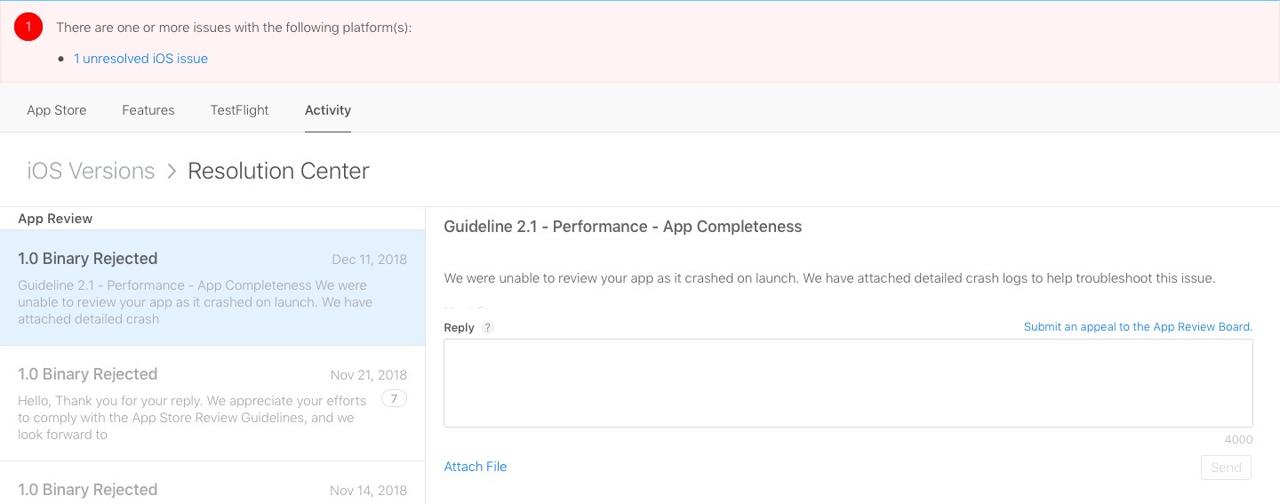
Apple send email when the app is rejected in review. if you got the email, go to App store Connect and check out what reject reason is.

especially, if app review rejection reason is App crash, Apple would send App crash log files.
Guideline 2.1 - Performance - App Completeness

We were unable to review your app as it crashed on launch. We have attached detailed crash logs to help troubleshoot this issue.

Next Steps

To resolve this issue, please revise your app and test it on a device to ensure it will launch without crashing.

Resources

For information on how to symbolic and read a crash log, please review Tech Note TN2151 Understanding and Analyzing Application Crash Reports.


crashlog-CDDAD5F8-F56A-470D-94BA-55149F76E390.txt
crashlog-D75B7641-0AF7-4DF4-8702-2E6665172390.txt
crashlog-3A0F07E3-874D-462F-9FFF-BCE88C98D224.txt
we can see details about how to check App crash log in Tech Note TN2151 Understanding and Analyzing Application Crash Reports link attached App review rejection reason.
first, download App crash log files.
download Symbol file
we need the Symbol file(dSYM) to analyze App crash log files. go to Activity tab in App Store Connect.

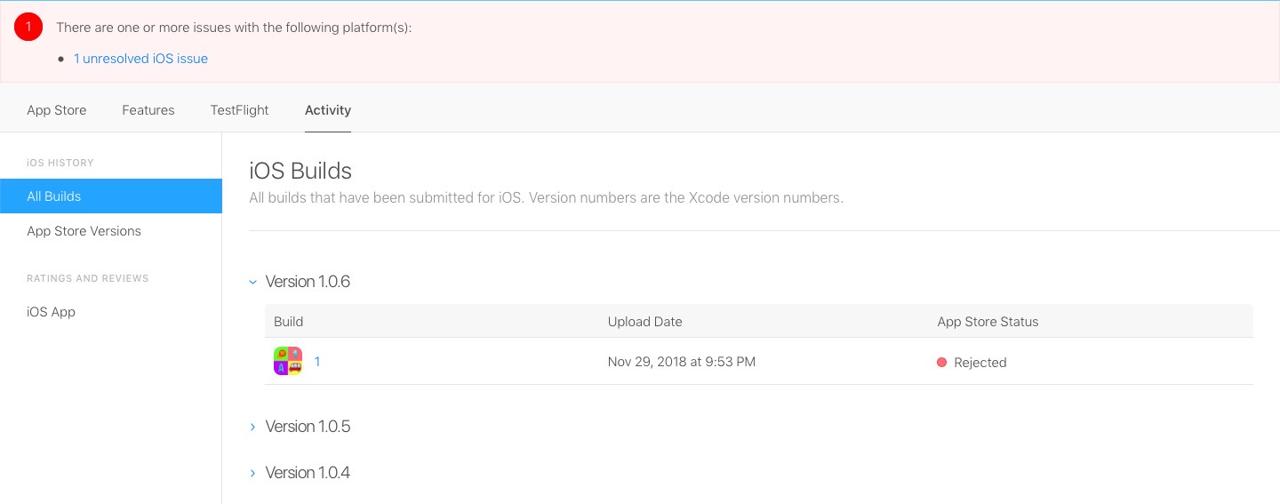
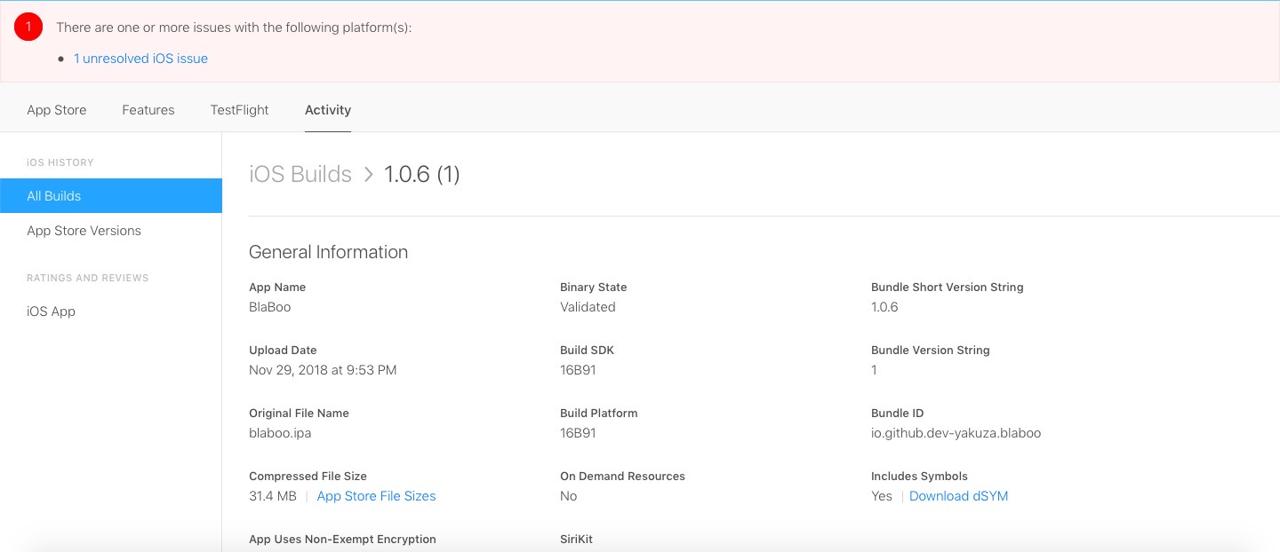
click All Builds menu on left side and select build version which you submitted for app review.

click Download dSYM on left bottom of the screen to download and unzip it.
7ED9CAAD-F7F7-31E6-8480-2D358FBEF9C7.dSYM
E3430BAD-2EB8-3B8D-8E04-4BB66E2A4E58.dSYM
analyze log files
let’s see how to analyze App crash log file. all log files have header like below.
Incident Identifier: 3A0F07E3-874D-462F-9FFF-BCE88C98D224
CrashReporter Key:   28b54437587b1ef1e81059e98250b166b0d343c8
Hardware Model:      xxx
Process:             blaboo [2012]
Path:                /private/var/containers/Bundle/Application/488E158A-64B5-439E-82BC-F702CF26E5DA/blaboo.app/blaboo
Identifier:          io.github.dev-yakuza.blaboo
Version:             1 (1.0.6)
AppStoreTools:       10B63
Code Type:           ARM-64 (Native)
Role:                Non UI
Parent Process:      launchd [1]
Coalition:           io.github.dev-yakuza.blaboo [661]


Date/Time:           2018-12-10 17:20:22.0217 -0800
Launch Time:         2018-12-10 17:20:01.9857 -0800
OS Version:          iPhone OS 12.1 (16B92)
Baseband Version:    7.21.00
Report Version:      104

Exception Type:  EXC_CRASH (SIGKILL)
Exception Codes: 0x0000000000000000, 0x0000000000000000
Exception Note:  EXC_CORPSE_NOTIFY
Termination Reason: Namespace SPRINGBOARD, Code 0x8badf00d
Termination Description: SPRINGBOARD, scene-create watchdog transgression: io.github.dev-yakuza.blaboo exhausted real (wall clock) time allowance of 19.94 seconds | ProcessVisibility: Foreground | ProcessState: Running | WatchdogEvent: scene-create | WatchdogVisibility: Foreground | WatchdogCPUStatistics: ( | "Elapsed total CPU time (seconds): 24.600 (user 24.600, system 0.000), 41% CPU", | "Elapsed application CPU time (seconds): 0.237, 0% CPU" | )
Triggered by Thread:  0
we can get rough information by searching Exception Type in header on https://appstoreconnect.apple.com/WebObjects/iTunesConnect.woa/ra/ng/app/1441741187/platform/ios/resolutioncenter site.
for example, Bad Memory Access [EXC_BAD_ACCESS // SIGSEGV // SIGBUS] is occurred when process accesses not existed memory or try to write something in read-only memory.
Exception Type:  EXC_CRASH (SIGKILL)
Exception Codes: 0x0000000000000000, 0x0000000000000000
Exception Note:  EXC_CORPSE_NOTIFY
Termination Reason: Namespace SPRINGBOARD, Code 0x8badf00d
Termination Description: SPRINGBOARD, scene-create watchdog transgression: io.github.dev-yakuza.blaboo exhausted real (wall clock) time allowance of 19.94 seconds | ProcessVisibility: Foreground | ProcessState: Running | WatchdogEvent: scene-create | WatchdogVisibility: Foreground | WatchdogCPUStatistics: ( | "Elapsed total CPU time (seconds): 24.600 (user 24.600, system 0.000), 41% CPU", | "Elapsed application CPU time (seconds): 0.237, 0% CPU" | )
Triggered by Thread:  0
our app crash reason is EXC_CRASH (SIGKILL). in this case, we should see Termination Reason. our Termination Reason code is 0x8badf00d. search this code in above link, we can know The exception code 0x8badf00d indicates that an application has been terminated by iOS because a watchdog timeout occurred..
now, go to the folder of symbol file(dSYM) exists via Terminal to see where crash is occurred.
# go to the folder of download files.
cd ~/Desktop/crash/
and open App crash log which Apple sent and see the top of the contents.
{
    ...
    "slice_uuid":"7ed9caad-f7f7-31e6-8480-2d358fbef9c7",
    ...
}
...

Thread 0 name:  Dispatch queue: com.apple.main-thread
Thread 0 Crashed:
...
10  Security                      	0x00000001e938b6d8 0x1e9314000 + 489176
11  Security                      	0x00000001e938944c 0x1e9314000 + 480332
12  Security                      	0x00000001e938bcd0 0x1e9314000 + 490704
13  blaboo                        	0x0000000100969608 0x10093c000 + 185864
14  blaboo                        	0x000000010096ddf0 0x10093c000 + 204272
15  blaboo                        	0x000000010097190c 0x10093c000 + 219404
...
we will analyze with the symbol file which matches slice_uuid in here. also find your app name in Thread 0 Crashed.
we’ll use the command introduced in Tech Note TN2151 Understanding and Analyzing Application Crash Reports site to analyze.
atos -arch arm64 -o TheElements.app.dSYM/Contents/Resources/DWARF/TheElements -l 0x1000e4000 0x00000001000effdcmodify this command like below with contents we searched above.
# "slice_uuid":"7ed9caad-f7f7-31e6-8480-2d358fbef9c7",
# 13  blaboo                        	0x0000000100969608 0x10093c000 + 185864
# atos -arch arm64 -o [slice_uuid].dSYM/Contents/Resources/DWARF/[AppName] -l [4th string: 0x10093c000] [3rd string: 0x0000000100969608]
atos -arch arm64 -o 7ED9CAAD-F7F7-31E6-8480-2D358FBEF9C7.dSYM/Contents/Resources/DWARF/blaboo -l 0x10093c000 0x0000000100969608
we can see below result when execute above command.
-[FIRInstanceIDAuthKeychain removeItemsMatchingService:account:error:] (in blaboo) + 136now, we can know roughly location where crash is occurred like above.
completed
we saw how to analyze App crash log which Apple has sent. after we checked our App crash log, we knew some problems are occurred in Admob and finally we found ADMOB_APP_ID was not set in GoogleService-Info.plist which we downloaded from Firebase. so we redownload GoogleService-Info.plist file from Firebase and build the app.
reference
- Tech Note TN2151 Understanding and Analyzing Application Crash Reports: https://appstoreconnect.apple.com/WebObjects/iTunesConnect.woa/ra/ng/app/1441741187/platform/ios/resolutioncenter
Was my blog helpful? Please leave a comment at the bottom. it will be a great help to me!
App promotion
Deku.Deku created the applications with Flutter.If you have interested, please try to download them for free.


